The Evolution of Benchmarks in Frontier Models
How the evaluations named in OpenAI, Google, and Anthropic model announcements change over time.
View on GitHub- Status
- Active
- Last updated
- Providers
- OpenAI, Google, Anthropic
- Models tracked
- 59
- Announcements
- 55
- Benchmarks observed
- 286
- Data through
- 2026-09-30
- License
- Apache-2.0
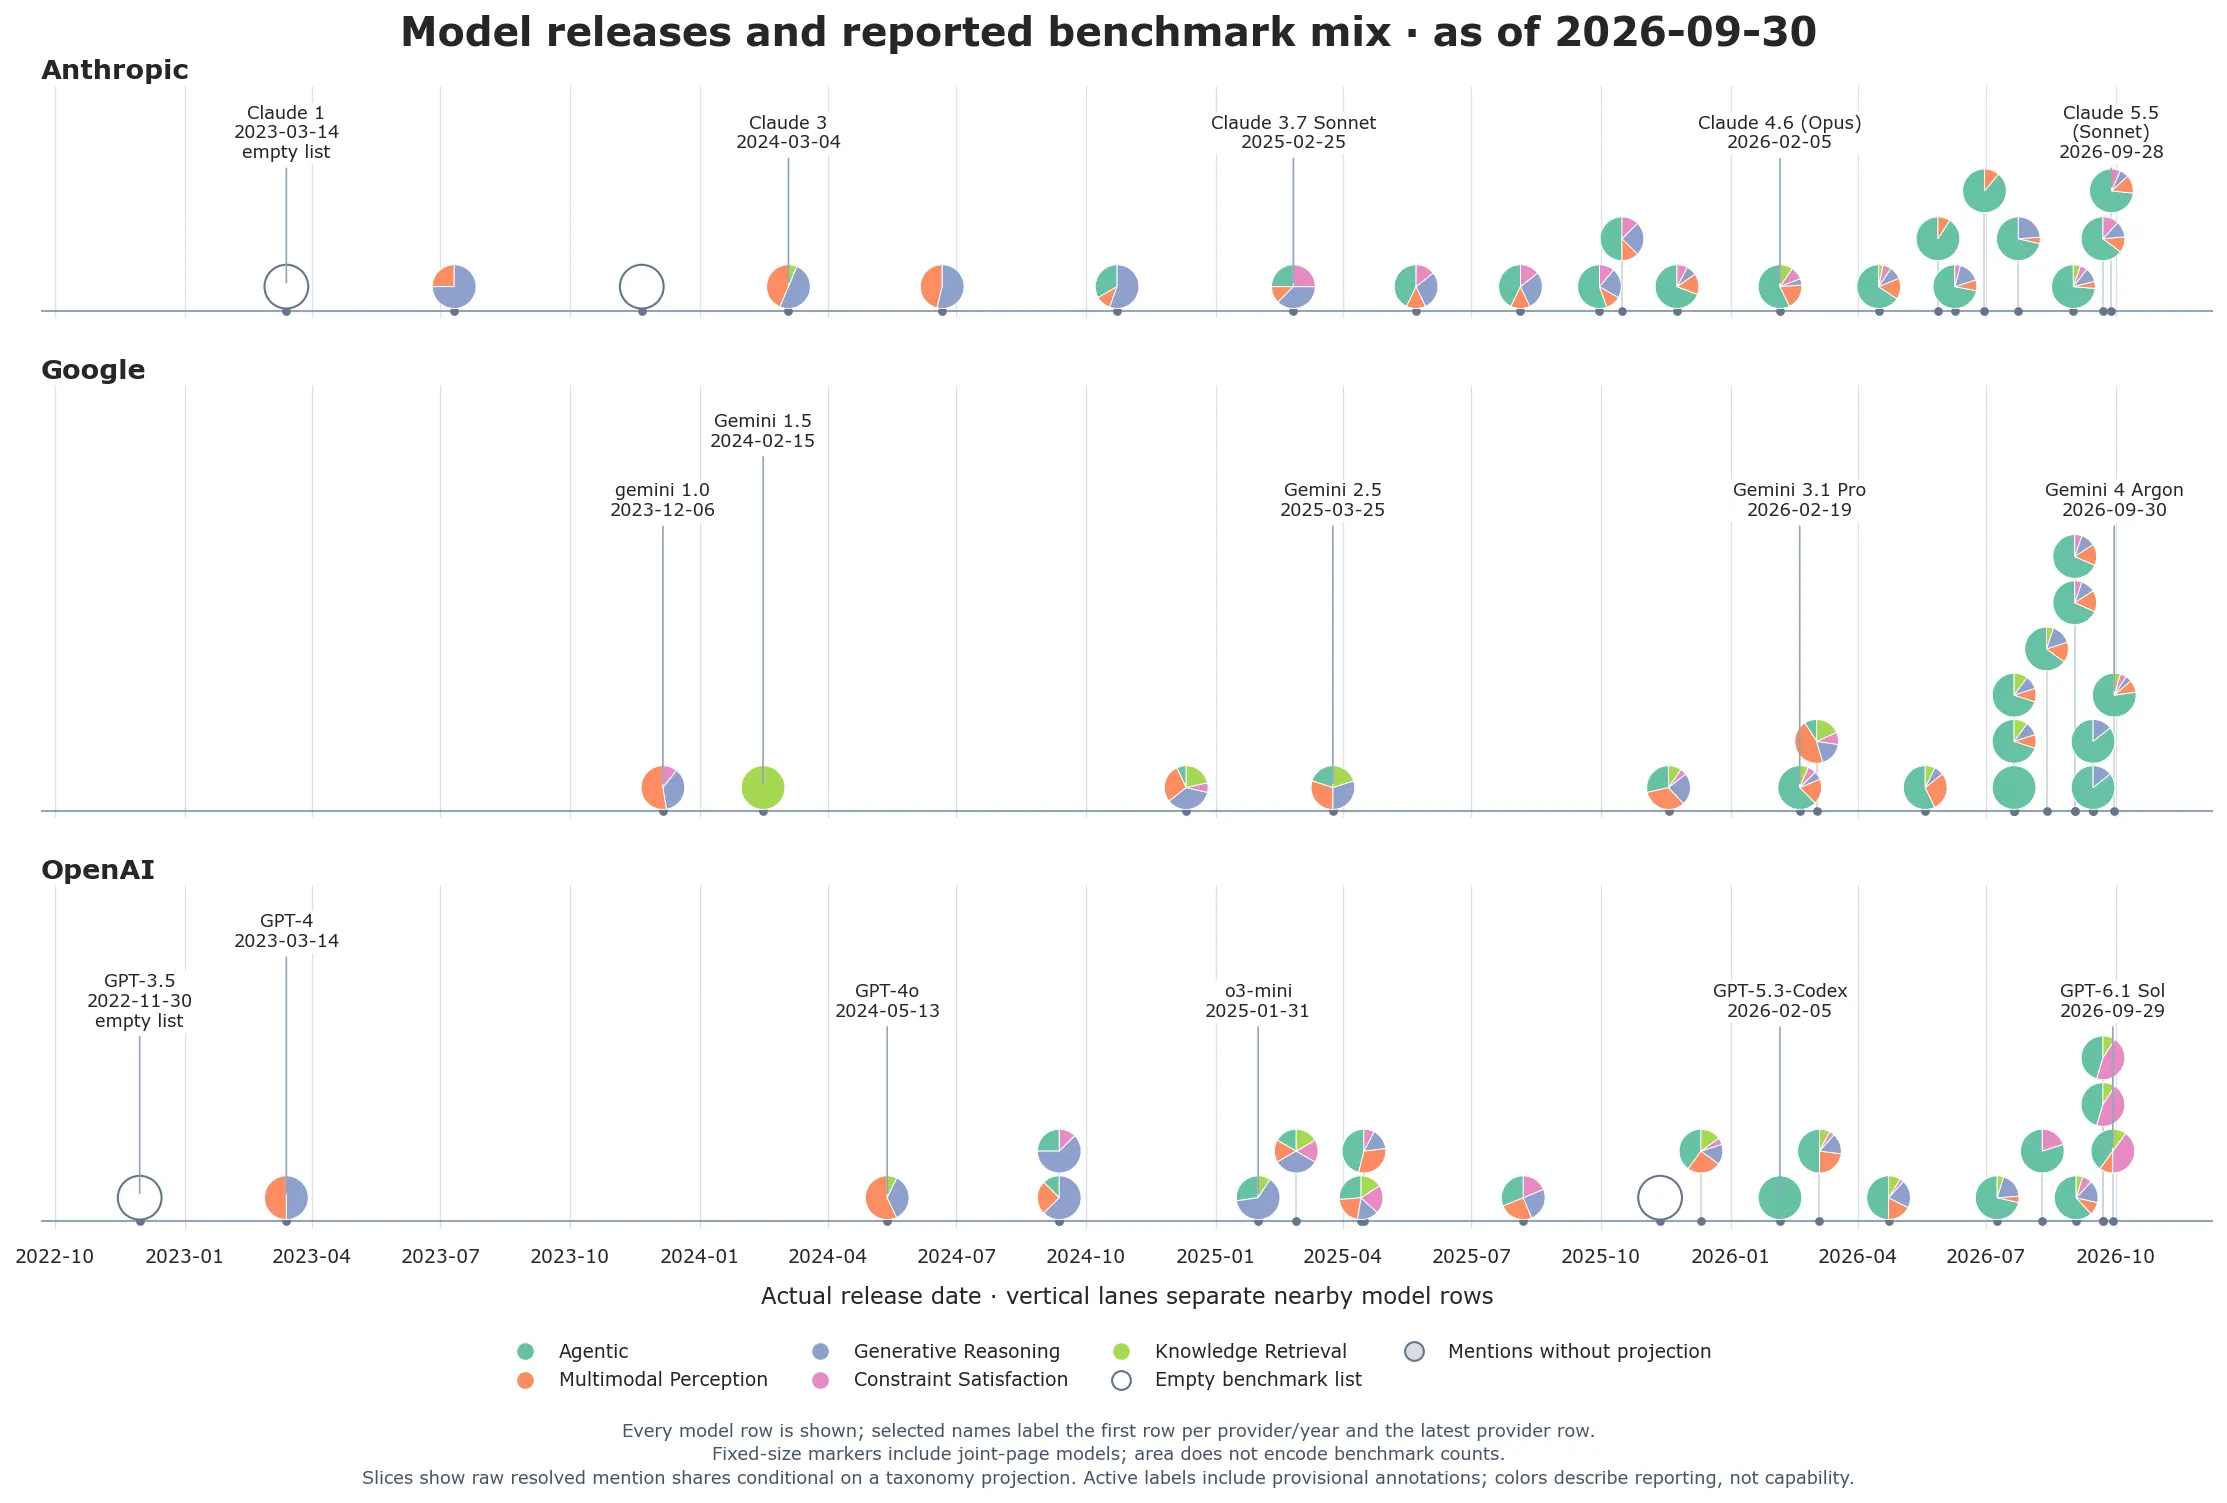
Which kinds of tasks appear in each model’s benchmark portfolio, the set of benchmarks named at its launch? How does that mix change over time? Which benchmarks become shared reference points, and which keep returning in later releases? This project pairs a visual history of model releases with a catalog that links every entry to its source and a reproducible analysis of how each benchmark has been reported over time.
The evidence is the benchmark names that appear on a selected set of public launch pages. A name counts wherever it appears: in a result, a comparison, a footnote, a list of a suite’s components, or a partner’s quotation. An appearance does not by itself mean that the page reports a score for the new model, that the benchmark is featured prominently, or that it was used in training.
The data currently covers 59 models from 55 announcements dated through September 30, 2026, and the search for new releases extends to October 4, 2026. Throughout this page, a model is one named model, and variants announced together are separate models that share one announcement. A benchmark is one entry in the project’s catalog: alternative names for the same benchmark resolve to a single entry, while explicit versions, such as Terminal-Bench 2.0 and 2.1, stay separate. The repository calls these units model rows and benchmark identities.
Benchmark types across model releases
The timeline at the top of this page places every model by provider and release date and draws the mix of its reported benchmarks as a pie chart. The five colors are task modes, a compact summary of the project’s more detailed taxonomy: Agentic, Multimodal Perception, Generative Reasoning, Constraint Satisfaction, and Knowledge Retrieval.
Every model is drawn, but only some are named, which keeps the overview readable; the fully labeled view names every one. Read the colors as a summary of the kinds of tasks represented on each launch page. The categories are derived from classification labels that are still provisional, and “Agentic” covers more than the explicit tool and environment interaction measured below. The methods for this view explain how the chart is drawn and how benchmarks without a classification are handled.

Benchmark types over time
A trailing 180-day window brings out how the mix changes over time. Each model with at least one recorded benchmark carries one unit of weight, split evenly across the benchmark mentions recorded for it. A benchmark that appears again in a later release counts again, so the chart shows the composition of reporting, not a count of newly created benchmarks. Within each window, the classified weight is scaled to 100%, and a window with no classified observations is left as a gap.
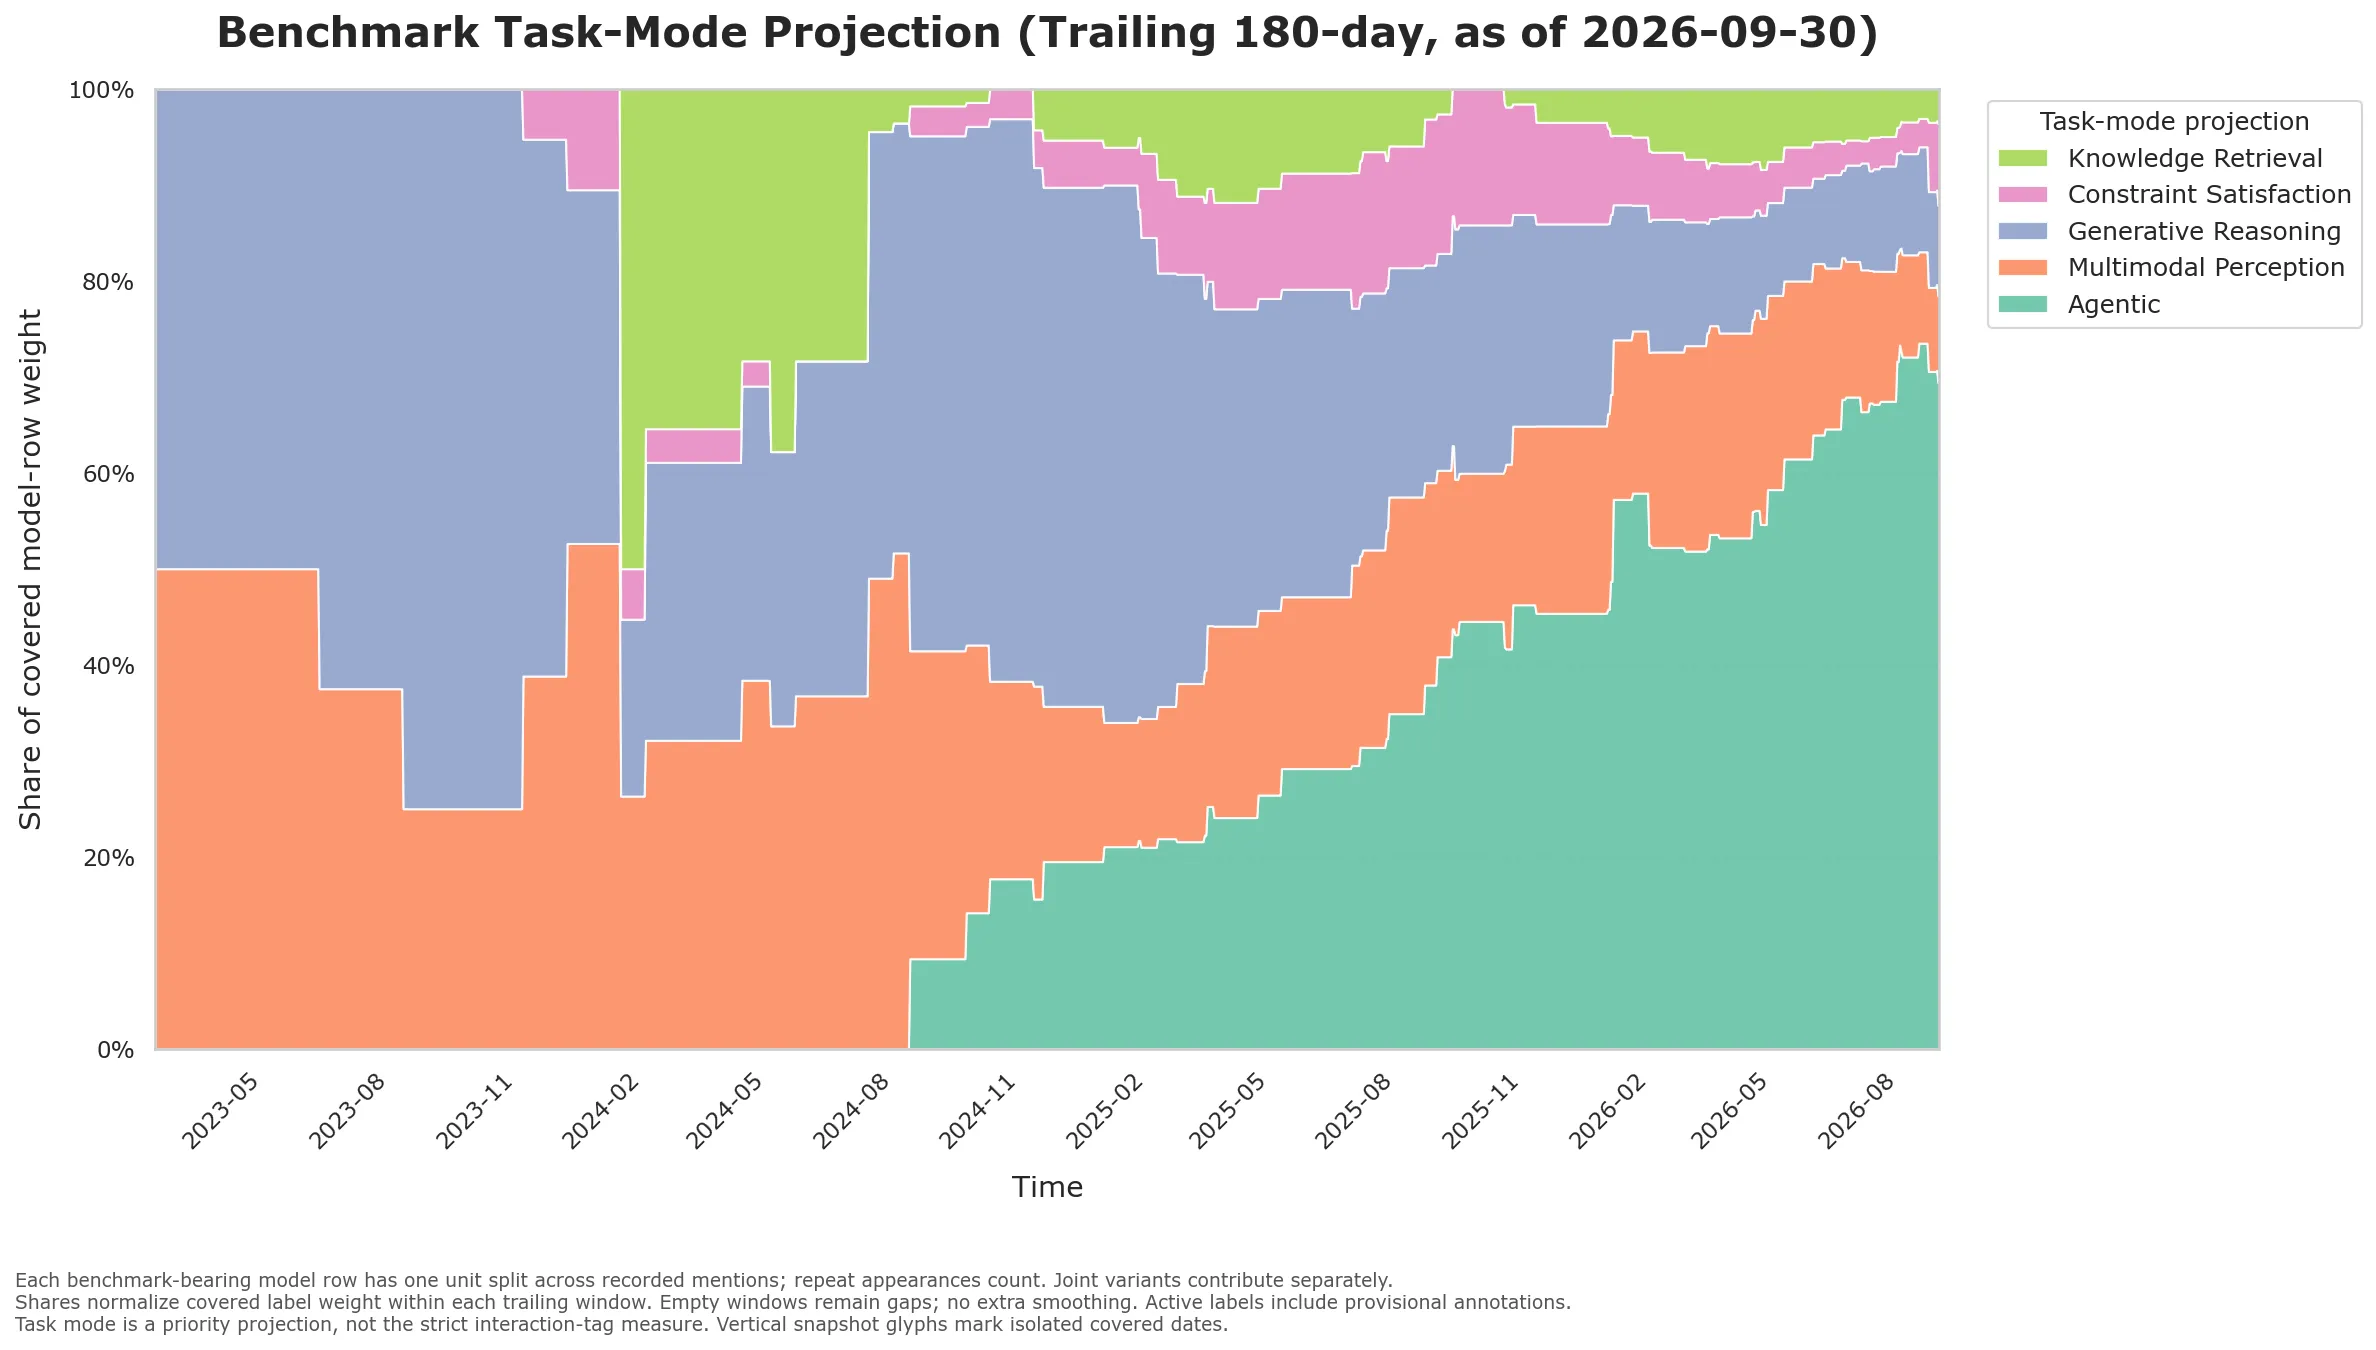
The chart describes reporting as seen through the taxonomy, and several things shape it. Releases are sparse in the early period, and the mix of providers shifts over time. Missing classifications and provisional labels affect the categories themselves. The task-mode and domain panels and the multi-facet view add complementary detail, and the trend methods set out the rules for windows, denominators, and missing data.


Both views count every named model separately, including variants announced together. The sharing and lifecycle analyses below instead count each announcement once, and the interaction analysis compares the two units.
A small shared set accounts for most reporting
Only 25.9% of the observed benchmarks appear at more than one provider, yet they account for 62.1% of benchmark–announcement observations, which count a benchmark once for every announcement that names it. Of the 286 observed benchmarks, 74 appear at two or more providers, and 38 of those appear at all three.
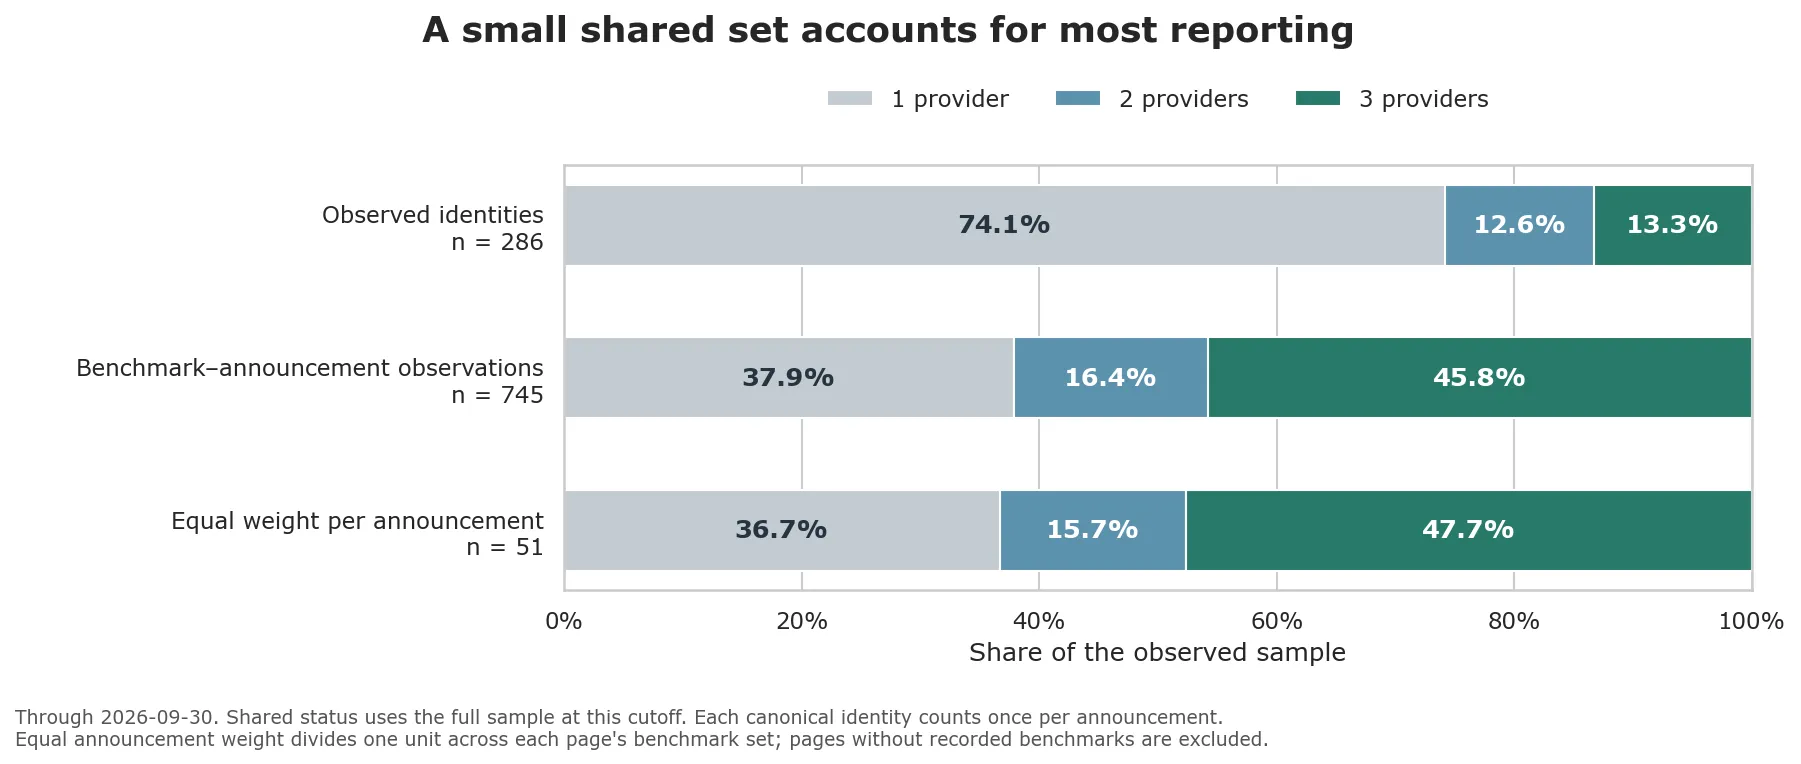
The pattern holds when every announcement counts equally. If each announcement that names at least one benchmark receives one unit of weight, divided across its benchmarks, shared benchmarks make up 63.3% of the average portfolio. Long benchmark tables and jointly announced variants therefore do not explain the shared majority by themselves.
This result counts catalog entries: explicit versions remain separate, while some older entries combine several variants. It does not show concentration among benchmark families, and it does not show that providers score a shared benchmark under comparable protocols. The counts under both weightings are in the repository.
Each benchmark has a reporting history
Of the observed benchmarks, 169 appear in only one announcement, and 136 of those first entered the sample in 2026. Recent arrivals have had less time to reappear, so a single appearance is not a finished lifetime. The lifecycle analysis follows every catalog entry through its first and last sightings, its recurrence, its spread across providers, and the gaps in its reporting.
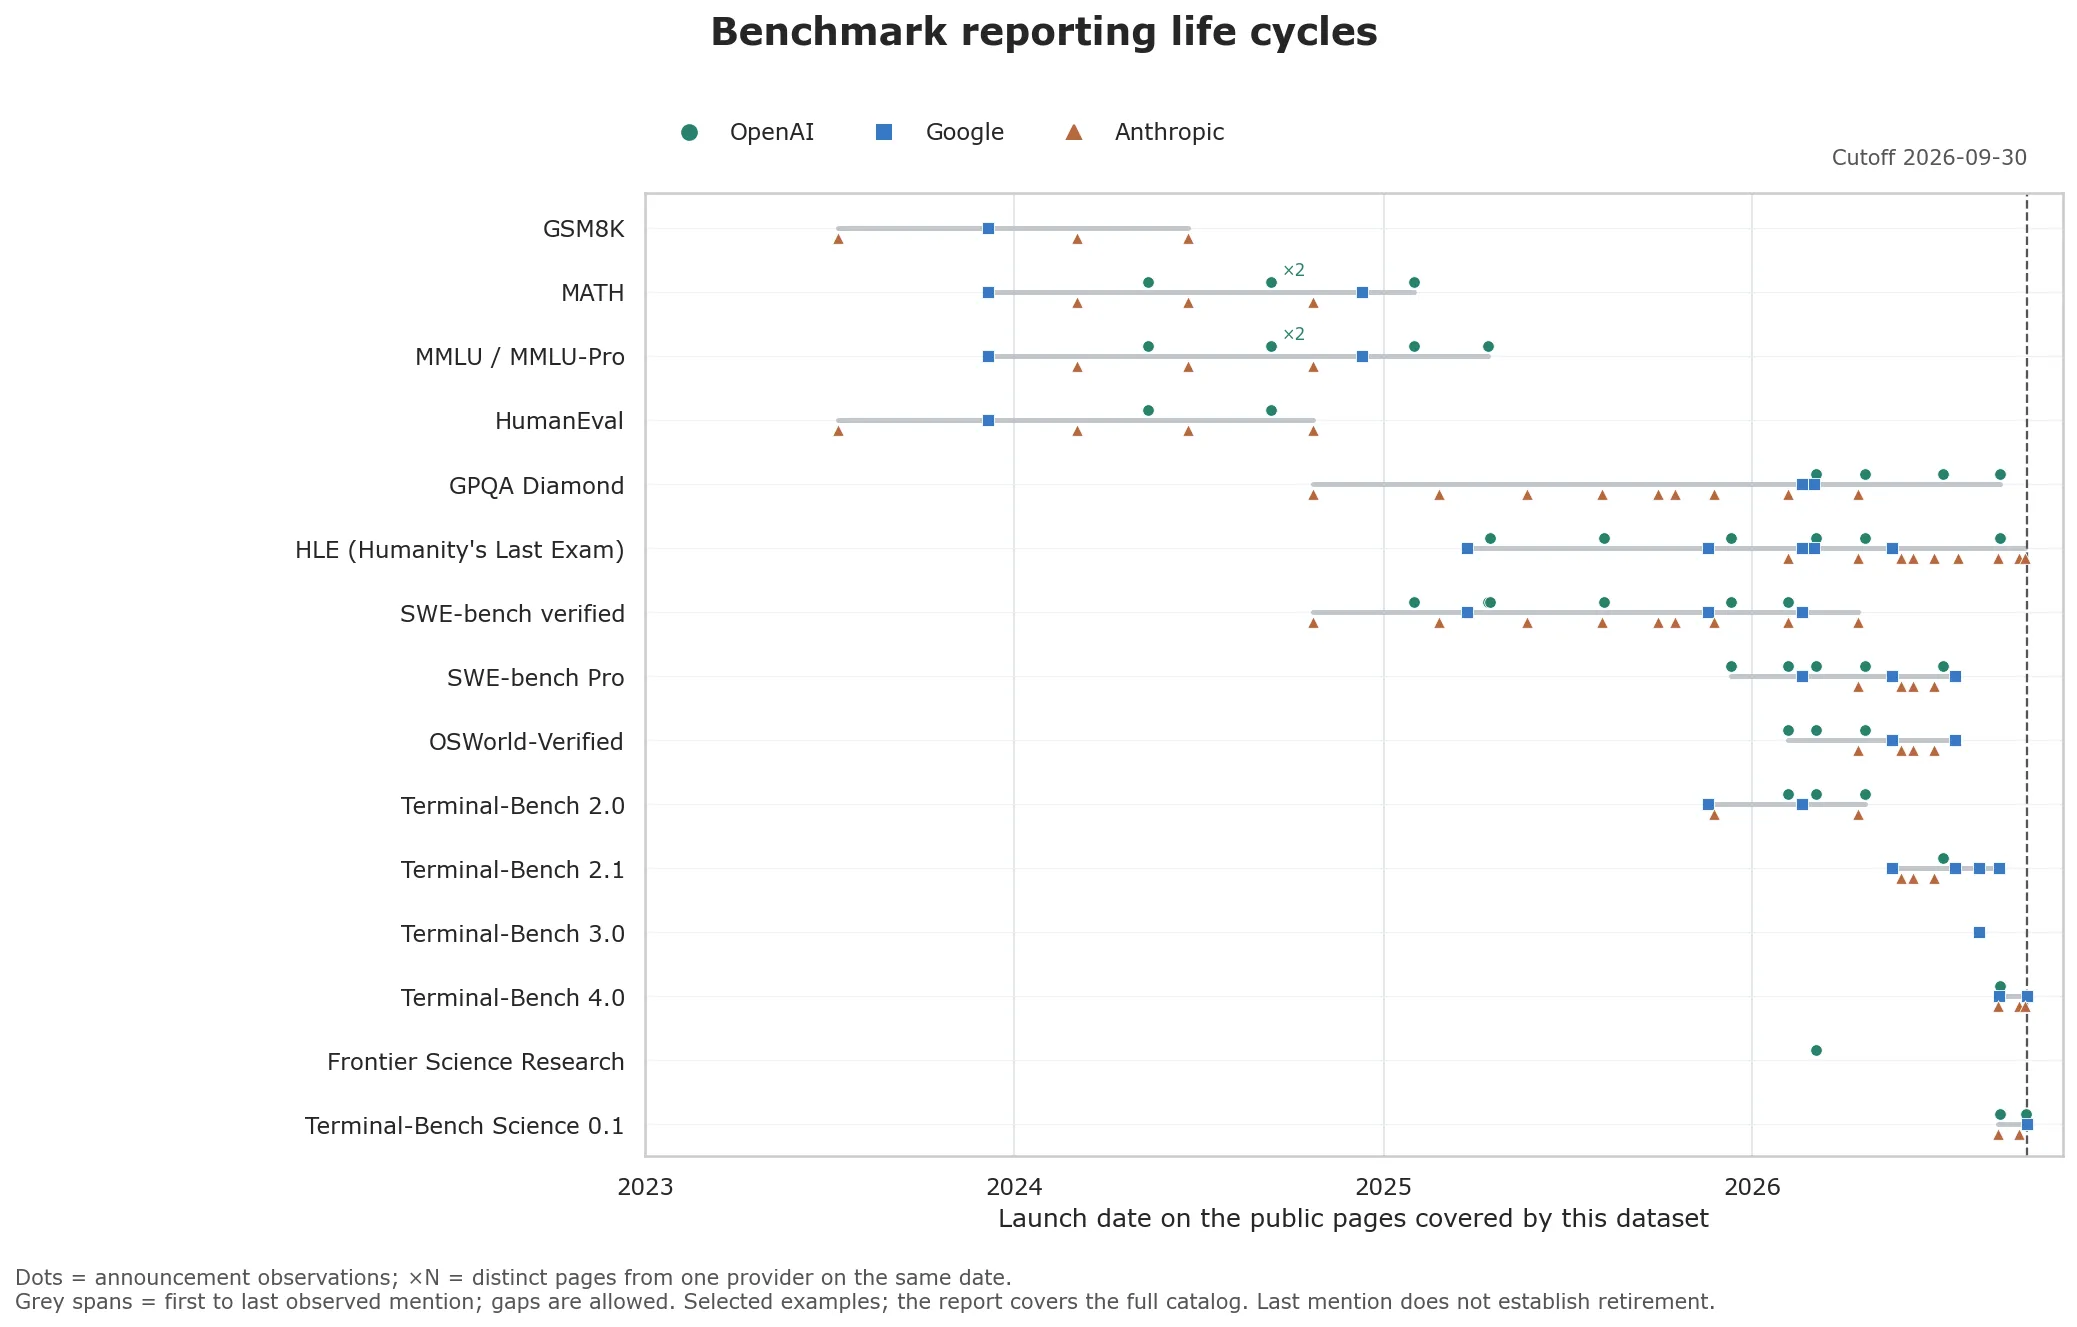
Each marker sits on an actual announcement date. The grey line connects a benchmark’s first and last sightings and can contain gaps. A last sighting does not establish that a benchmark has been retired, saturated, or replaced. The complete catalog report covers all 288 entries, including 2 not yet observed by this cutoff. The provider histories also count each provider’s later launches, including pages with no recorded benchmarks, so a gap can be read against that provider’s release cadence.
How often does reporting spread to another provider?
The table shows how many benchmarks are seen at a second provider within a fixed window after their first appearance. A benchmark is eligible only when the entire window fits inside the period the data covers, and benchmarks that never reach a second provider are included.
| Follow-up window | Eligible benchmarks | Seen at a second provider within the window | Share |
|---|---|---|---|
| 30 days | 209 | 26 | 12.4% |
| 90 days | 160 | 50 | 31.2% |
| 180 days | 113 | 45 | 39.8% |
Each row has a different set of eligible benchmarks. The clock starts at a benchmark’s first mention in this dataset, not at its publication, and an eligible window does not necessarily contain a launch by another provider. Follow-up ends on 2026-09-30. These shares describe reporting in this sample; they are not a survival curve or a field-wide probability of adoption. The window definitions and evidence are in the overview methods.
How much depends on the classification?
The project also measures explicit interaction with tools or environments. This narrower measure requires an interaction label for tool use, an environment, a browser, a terminal or codebase, or computer control. Static code generation, unit-test scoring, and planning do not qualify on their own.
Take 2026, with equal weight for each announcement that names a benchmark. Counting all active labels, provisional ones included, 64.0% of portfolio weight carries a tool or environment interaction label. Keeping only labels with a confidence rating of at least 0.70 gives 17.2%. With that filter, only 36.6% of portfolio weight has any label on the interaction axis. Accepted labels, those that have passed review, cover 0.0%.
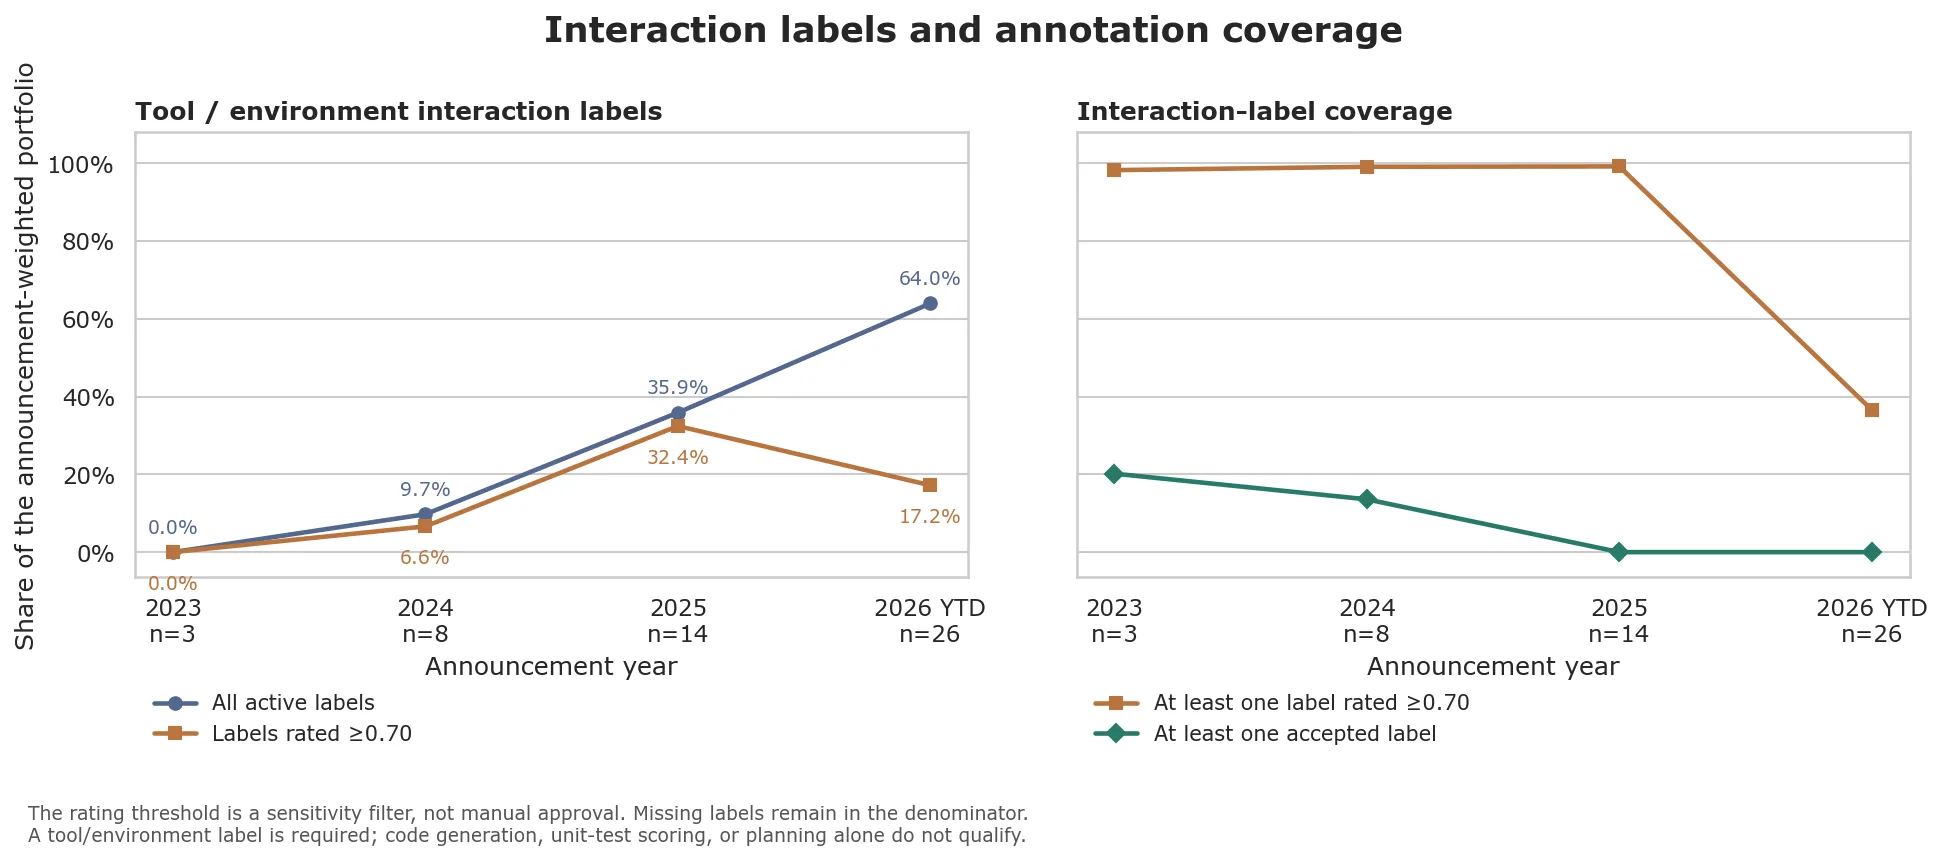
The gap between the two estimates makes label quality part of the result. A confidence rating of at least 0.70 is a sensitivity filter, not a completed review. Benchmarks without a label keep their weight in the denominator. Zero coverage by accepted labels means there is no reviewed basis for an estimate; it is not evidence that interaction is absent.
| Year | Announcements | Share, all active labels | Share, labels rated ≥0.70 | Coverage, labels rated ≥0.70 | Coverage, accepted labels |
|---|---|---|---|---|---|
| 2023 | 3 | 0.0% | 0.0% | 98.2% | 20.2% |
| 2024 | 8 | 9.7% | 6.6% | 99.1% | 13.6% |
| 2025 | 14 | 35.9% | 32.4% | 99.2% | 0.0% |
| 2026 YTD | 26 | 64.0% | 17.2% | 36.6% | 0.0% |
The shares and the coverage figures use the same denominator: the full weight of all announcements, labeled or not. Coverage means that at least one interaction label remains after filtering, including labels for static tasks. Counting by model instead of by announcement changes the 2026 estimate based on all active labels from 64.0% to 64.4%. The provider-level comparisons and the exact labels retained allow closer inspection. The older broad proxy for software and tool tasks also counted static coding tests and remains as an exploratory comparison.
Sample and method
| Provider | Models | Announcements | With benchmarks | First tracked | Latest tracked |
|---|---|---|---|---|---|
| Anthropic | 21 | 21 | 19 | 2023-03-14 | 2026-09-28 |
| 17 | 14 | 14 | 2023-12-06 | 2026-09-30 | |
| OpenAI | 21 | 20 | 18 | 2022-11-30 | 2026-09-29 |
The sample covers selected general-purpose frontier releases and their cybersecurity variants, including launches with restricted access. It is not an exhaustive history of models.
Of the 55 announcements, 51 name at least one benchmark, and together they yield 745 benchmark–announcement observations. An announcement is identified by its provider, release date, and normalized source URL, and benchmark aliases resolve through exact mappings. The annual inventory shows how uneven the coverage is from year to year, and the overview methods define the denominators and reconcile the counts of raw labels, models, and announcement observations.
A named suite and its components can both appear, so the counts are not counts of independent tests. Some older labels combine versions, and launch pages may have been edited since release. A first sighting is the first appearance in this sample, not archival proof of when a benchmark entered public use.
The classification table contains 4,052 labels: 36 are accepted, 3,956 still need review, and 60 were generated from an older taxonomy without full review. Approving a benchmark’s identity and approving its labels are separate steps. The data audit records corrections, including MTOB’s task definition and previously missing mentions, along with the unresolved lineage of MRCR. The release audit records what the search for new releases covered.
Explore the evidence
| Question | Start here |
|---|---|
| Which benchmarks did a launch page name? | Model inventory and source URLs |
| What does a benchmark name refer to? | Catalog, aliases, distinctness decisions |
| Where has a given benchmark appeared? | Complete lifecycle report and source-linked observations |
| How many benchmarks does each release report? | Benchmark counts per release |
| What about long context, benchmark authorship, and similarity between providers? | Supporting analyses |
| Which classifications need more work? | Label data, review priorities, review guidelines |

Further progress depends on three things: reviewing the provisional labels that most affect the results, documenting how benchmarks relate by family and implementation, and recording whether each mention is a direct result, a comparison, a suite component, or a quotation. The current synthesis separates the supported findings from these open research questions.
The repository README explains how to reproduce the analysis and extend the data.
Comments
Sign in with GitHub to leave a comment or reaction. View discussions on GitHub